MARVEL UNIVERSE
Explore Marvel Cinemic Universe
Nov 2021 - Dec 2021
Project completed at Zhejiang University with Haotian Chen, Xinli Chen
Role : team leader, backend developer, interaction designer
PURPOSE OF VISUALIZATION
Marvel Cinematic Universe attracts universal audiences, and one of the main reasons is that it has abundant characters with rich features and abilities. Therefore, we chose Marvel characters as the base of our visualization project.
Specifically, we want to visualize characters’ well-rounded personal information, relationships between characters, and further, hidden information buried in data.
DATA
We collected data and classified character attributes into following four dimensions.
Basics
id
name
if alive
align
identity
first appearance
movie
profile
Abilities
power
durability
energy
fighting skills
identity
intelligence
speed
strength
Outlook
height
weight
species
fighting skills
gender
eye color
hair color
Advanced
education
group affiliation
relationships
origin
other aliases
Python crawler from Marvel.com
Python crawler from the Straits Times
Existing datasets
VISUALIZATION STRATEGY
We then analyzed these attributes, and further classified them into numeric and non-numeric attributes, towards which we had different visualization strategies.
Numeric
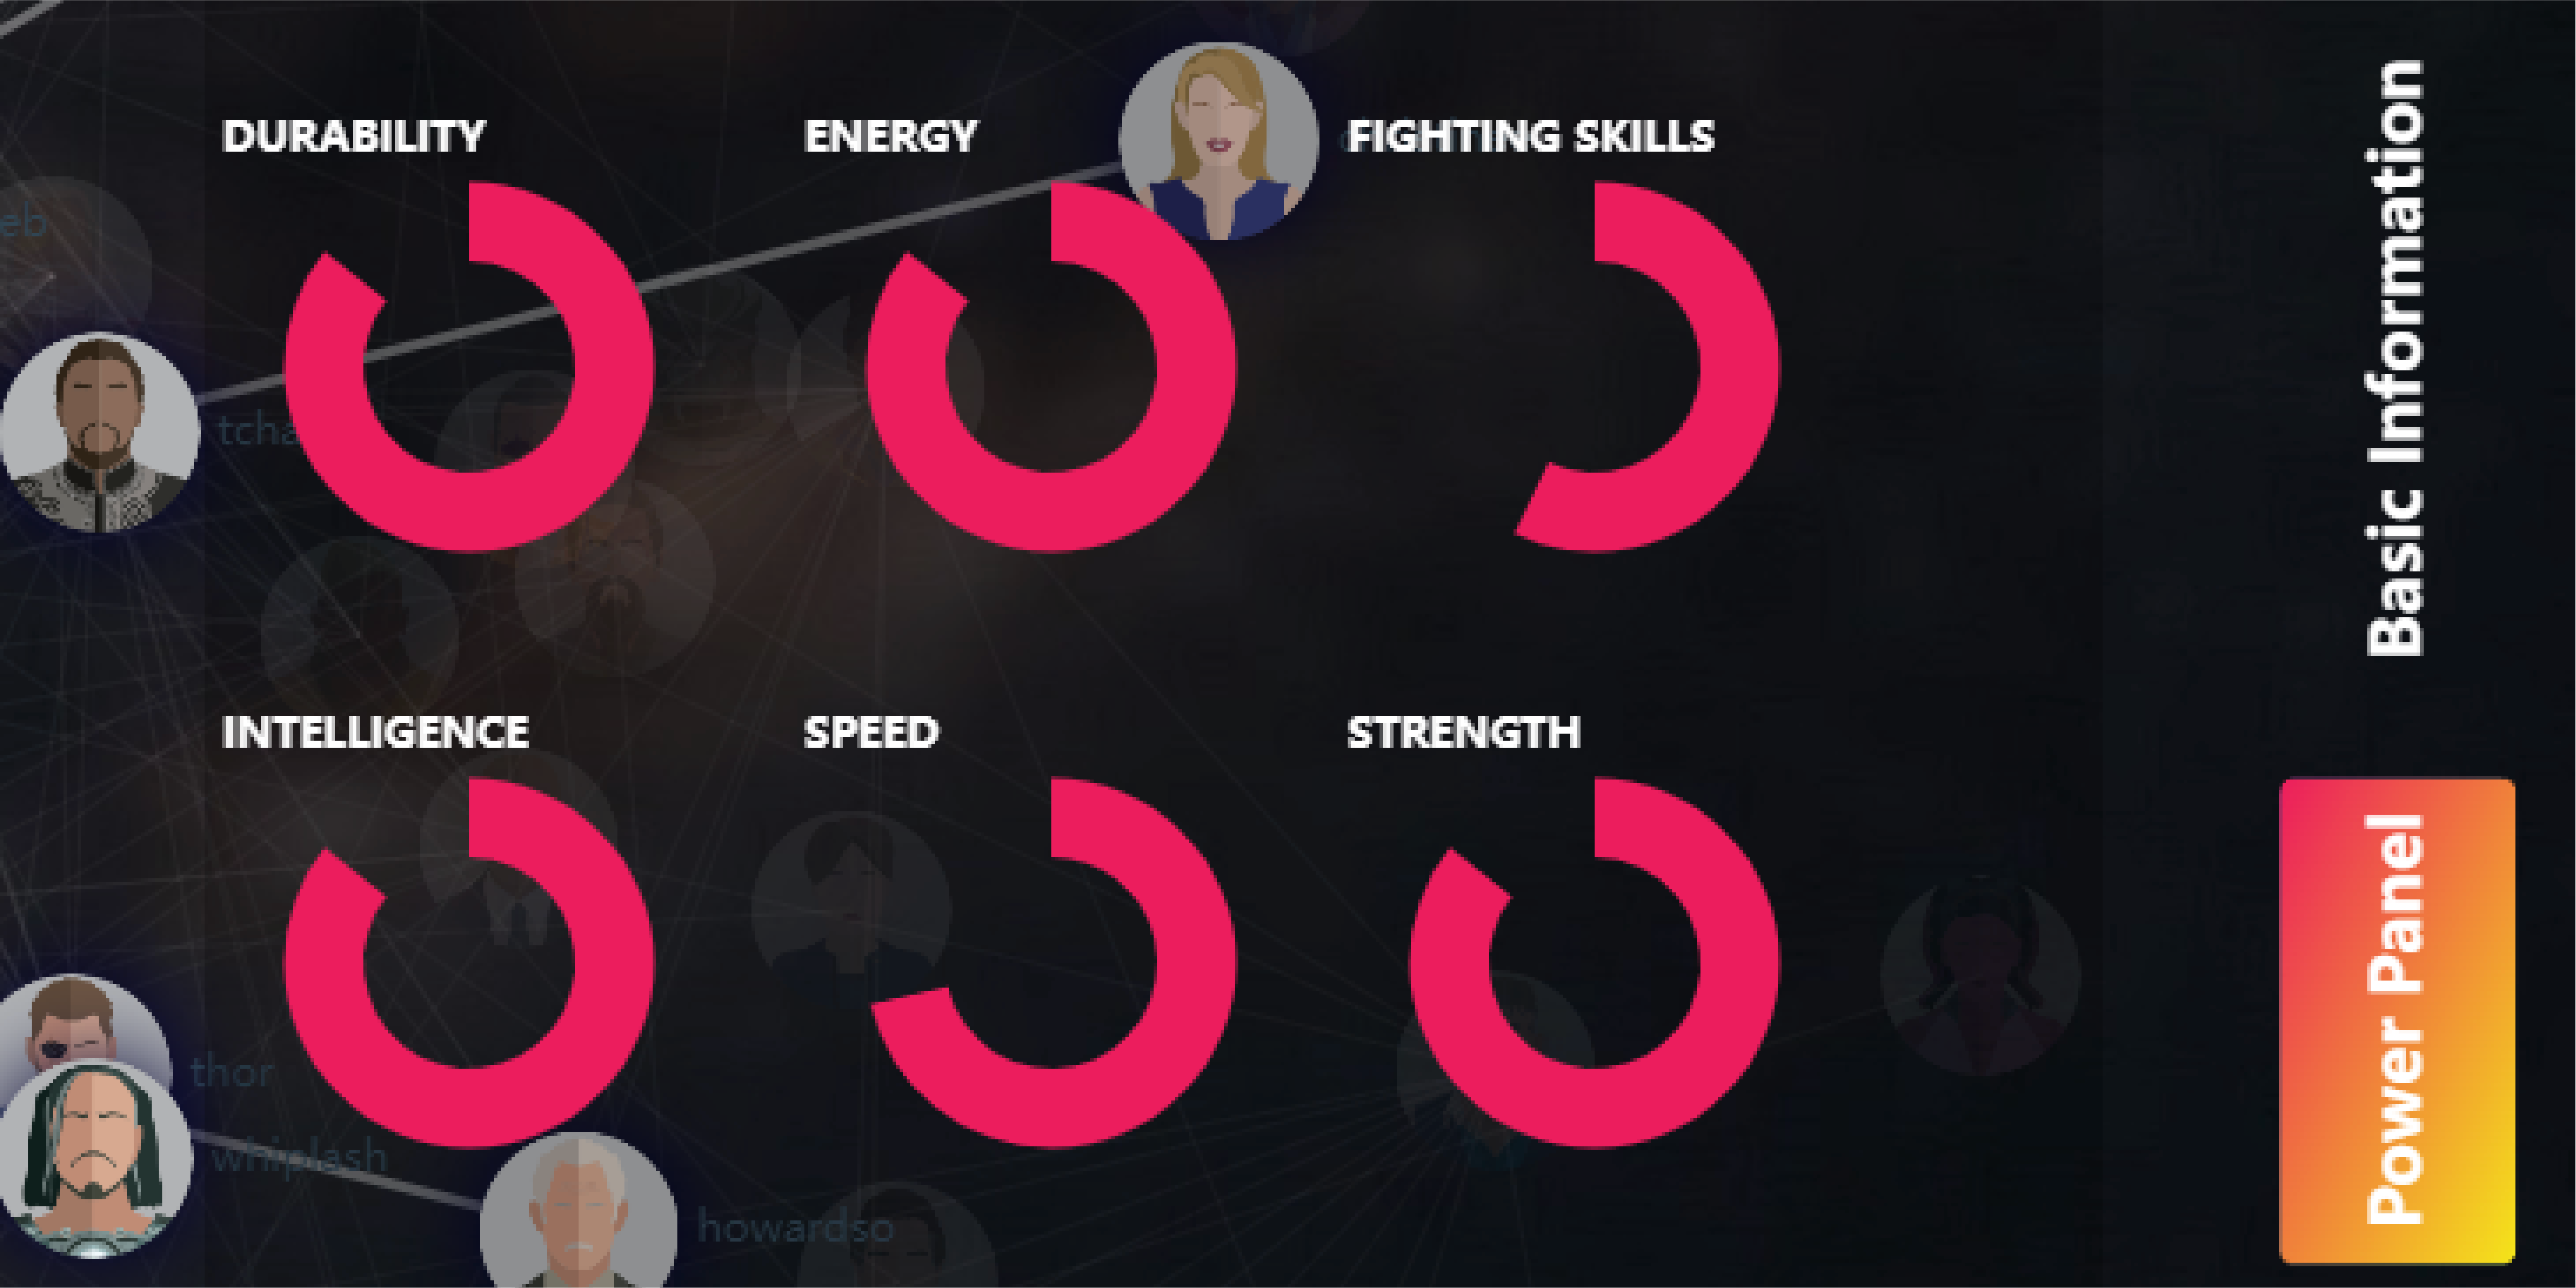
➊ One group of numeric attributes is the "six-dimension abilities" of each character, including durability, energy, fighting skills, intelligence, speed, and strength.
When we need to visualize the "six-dimension abilities" of one given character, donut chart is used to present these six dimensions separately.
When we need to compare the "six-dimension abilities" of two characters, radar chart is used to make the comparison of these six dimensions clearer.

❷ Another group includes personal information like height and weight. We used glyph to represent these two attributes.
The glyph for height demonstrates the height of a certain character in comparison to shortest(left) and tallest(right) character in Marvel.

The glyph for weight demonstrates the weight of a certain character equals how many ordinary people (70kg, 0-100% opacity: 0-70kg).

Non - Numeric
relationships
When it comes to visualization of relationships, we utilized network graph using force layout.
other non-numeric attributes
With the complexity of non-numeric attributes comes the difficulty in visualizing them. As a result, we created an interactive visualization method: you can "chat" with characters to get information.
EXPLORE HIDDEN INFORMATION
We use multiple visualization strategies to present existing data and information, yet we want to further reveal and visualize hidden information.
Find Connections Between Characters
Based on Breadth-First Search (BFS), users can find connections between any two characters and compare their attributes.
Co-occurrence Matrix
We also designed and developed the Marvel version of Co-occurrence Matrix. Find out more about Co-occurrence Matrix here.
Based on this matrix, we can see some of them are affiliated to the same group (e.g. Avengers, Hydra, etc.) and the relation between these groups (e.g. Avengers and Hydra are enemies).
Find Correlation Between Variables
Want to see how gender affects a character's align? Users can also explore the correlation between variables. And our system will automatically choose the suitable visualization chart to present the data.
Generate Your Own Marvel Character
Users can also type in their personal information to generate their Marvel avatar. A deep neural network is used to predict the "six-dimension abilities" of the user if he/she is a character in Marvel.
SYSTEM FRAMEWORK
I created a visualization for our visualization system, to visualize what tools we used and what visualization outcomes were achieved (kind of mouthful uhm..).